-
Introducing DCM
I’m happy to (finally) share our OSDI 2020 paper on Declarative Cluster Managers (DCM).
The premise for DCM is that writing modern cluster management code is notoriously hard, given that they routinely grapple with hard combinatorial optimization problems. Think of capabilities like policy-based load balancing, placement, scheduling, and configuration, which are features not only required in dedicated cluster management systems like Kubernetes, but also in enterprise-grade distributed systems like databases and storage platforms. Today, cluster manager developers implement such features by developing system-specific best-effort heuristics, which achieve scalability by significantly sacrificing the cluster manager’s decision quality, feature set, and extensibility over time. This is proving untenable, as solutions for cluster management problems are routinely developed from scratch in the industry to solve largely similar problems across different settings.
With DCM, we propose a radically different architecture where developers specify the cluster manager’s behavior declaratively, using SQL queries over cluster state stored in a relational database. From the SQL specification, the DCM compiler synthesizes a program that, at runtime, can be invoked to compute policy-compliant cluster management decisions given the latest cluster state. Under the covers, the generated program efficiently encodes the cluster state as an optimization problem and solves it using a constraint solver, freeing developers from having to design ad-hoc heuristics.
We show that DCM significantly lowers the barrier to building scalable and extensible cluster managers. We validate our claim by powering three systems with it: a Kubernetes scheduler, a virtual machine management solution, and a distributed transactional datastore.
If you’re interested in the details, check out the paper. If you’d like to try out DCM, have a look at our Github repository. We welcome all feedback, questions, and contributions!
-
Low-level advice for systems research
There’s no shortage of “how to do research advice” on the Internet for graduate students. Such advice, while inspiring, is extremely hard to translate into daily or weekly productivity as a systems PhD student.
This is unfortunate, because I believe following good practices can offset a lot of the stress associated with systems research. Having discussed this topic often with students, I think it’s time to blog about it.
We’ll cover two broad topics: how to effectively prototype and how to run experiments systematically.
On the prototyping side, we’ll first cover the tracer bullet methodology to gather incremental feedback about an idea. We’ll then discuss the importance of testing your code.
Regarding experiments, I’ll first argue for preparing your experiment infrastructure as early as possible in a project. I’ll then share some tips on automating experiments, avoiding tunnel vision, experimentation-friendly prototyping, and end with some advice on understanding your results.
Disclaimer
As with any advice from people who landed research positions after their PhDs, remember that survivor bias is a thing. I can only say that following these guidelines work well for me, there is no guarantee that it will work for you.
Who is this article for?
This article might help you if you’re a systems PhD student, and one or more of the following bullets resonate with you:
- You’re spending a lot of time building your system, and you’re unsure whether it will be worth it at all.
- There are many components of your system left to implement, and you’re not sure what you should prioritize over others.
- You find setting up, understanding, and debugging experiments overwhelming.
The premise
The premise for this article is the following comic I drew a while ago.
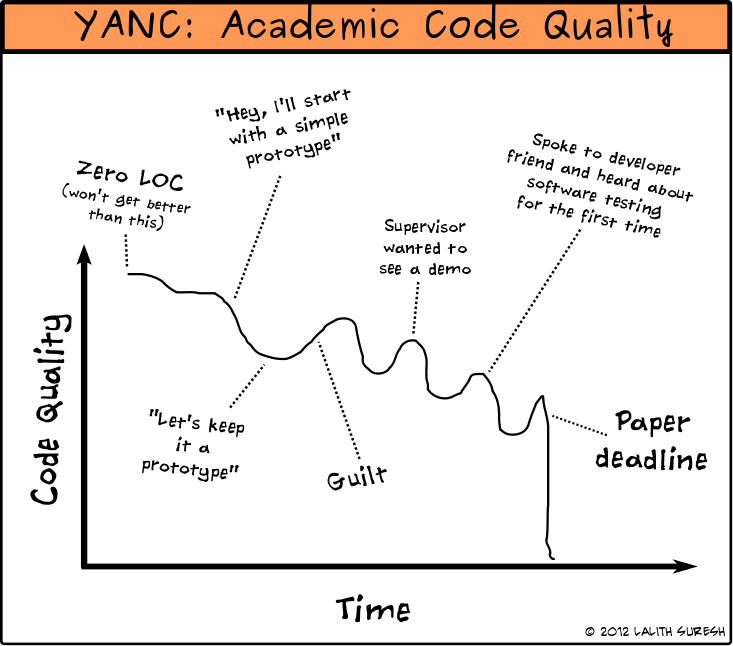
You have a finite amount of time, there’s a lot of systems work to do, there’s a submission deadline looming, and that worries you. As you get closer to the deadline, things will inevitably get chaotic. This article will hopefully help you effectively plan and alleviate some of that chaos.
Effective Prototyping
Your research prototype’s goal is to exercise a certain hypothesis. To validate that hypothesis, you will eventually subject your prototype to a set of experiments. More often than not, the experiments will compare your system against one or more baseline systems too.
Your goal through this process is to:
- prototype in a way that you get continuous, incremental feedback about your idea
- test for correctness during development time, so you don’t have to during experiments; debugging performance problems and system behavior over an experiment is hard enough
- build the experiment setup and infrastructure as early as possible, and preferably even before you build the system (rather than building the system first, and then thinking about experiments)
- Save time by automating the living crap out of your experiment workflow
The Tracer Bullet Methodology
I picked up this term from The Pragmatic Programmer book.
Here’s the problem. Let’s say you have multiple components to build before your system will work end-to-end. Each of these components might be complex by themselves, so building them one after the other in sequence and stitching them together might take a lot of time. That’s risky if you don’t yet know whether this system is worth building: you don’t want to spend a year building something, only to find out you’ve hit a dud.
Instead, focus on building a working end-to-end version early that might even only work for one example input, taking as many shortcuts as you need to get there (e.g., an interpreter that can only run the program “1 + 1” and nothing else). From there evolve the system to work with increasingly complex inputs, filling in gaps in your skeleton code and eating away at hardcoded assumptions and shortcuts as you go along. The benefit of this approach is that you always see the system work end-to-end, for more and more examples, and you receive continuous, incremental feedback on a variety of factors throughout the process. This strategy applies at any granularity of your code: the entire system itself, specific modules within them, or even specific functions.
For example, in the DCM project, we observed that developers expend a lot of effort to hand-craft ad-hoc heuristics for cluster management problems. We hypothesized that a compiler could instead synthesize the required implementation from an SQL specification. Doing so would make it easier to build cluster managers and schedulers that perform well, are flexible, and compute high-quality decisions.
When we started working on DCM, we weren’t even sure if this idea was practical, and whether SQL was an expressive enough language for the task-at-hand. Building a fully functional compiler that generated fast-enough code would have taken a while, and we wanted to validate the core hypothesis early. So to get started, we took a cluster management system, expressed some of its logic in SQL, and had the compiler emit code that we’d mostly written by hand. We tried this for several cluster management policies and received steady feedback about our design’s feasibility along the way. Importantly, even before we had filled in the compiler’s gaps, we had a working end-to-end demo running within a real system, which gave us the required confidence to double down on the idea.
Testing
Test your code thoroughly before you run experiments. The additional time you invest in writing tests and running them on every build will be more than made up by not having to debug your system for correctness when you run experiments. Debugging performance issues and system behavior during an experiment is daunting enough as it is: don’t compound this by debugging correctness issues at the same time.
When working on a complex system (especially with multiple authors), tests are essential to slowing down the rate at which bugs and regressions creep in over time. When you find a new bug in your system, add a new test case to reproduce the bug.
Only use a given commit/build of your system for an experiment if it has passed all tests.
Test every build and commit using a continuous integration (CI) infrastructure. A CI system monitors a repository for new commits and runs a series of prescribed test workflows. There are free solutions like Travis you can easily use. You can also self-host your CI infrastructure using Gitlab CI.
A common pushback I’ve heard about rigorously testing research prototypes is “Hey! We’re trying to write a paper, not production code!”. That statement, however, is a non sequitur. A research prototype with tests is not a production system! I’m not suggesting that you add metrics, log retention, compliance checks, rolling upgrades, backwards compatibility, and umpteen other things that production systems need (unless they’re relevant to your research, obviously).
Use any automated tooling available to harden your code. For example, I configure all my Java projects to use Checkstyle to enforce a coding style, and both SpotBugs and Google ErrorProne to run a suite of static analysis passes on the code. I use Jacoco and tools like CodeCov for tracking code coverage of my tests. Every build invokes these tools and fails the build if there are problems. The CI infrastructure also runs these checks whenever I push commits to a git repository.
Experiments
A common trap that students fall into is to not think about experiments until their system is “ready”. This leads to the same problem we just discussed about not getting incremental feedback.
Set up the experiment infrastructure early
Most systems papers often have one or more baselines to compare against. If so, set up the experiment infrastructure to measure the baselines as early as possible, even before you start formulating a hypothesis about something you’d like to improve. Use the data collected from studying the baselines to formulate your hypothesis.
From my own experience, you’re likely to find problems others haven’t noticed (prior art can be surprisingly flimsy sometimes). You’ll also learn whether the problem you’re studying is even real at all. Either way, you’ll gain valuable ammunition towards formulating a good hypothesis.
Automate your experiments like a maniac
The main goal for your experiment setup should be to completely automate the entire workflow. And I mean the entire workflow. For example, have a single script that given a commit ID from your system’s git repository, checks out that commit ID, builds the artifacts, sets up or refreshes the infrastructure, runs experiments with all the parameter combinations for the system and the baselines, cleans up between runs, downloads all the relevant logs into an archive with the necessary metadata, processes the logs, generates a report with the plots, and sends that report to a Slack channel.
When running experiments, make sure to not only collect log data and traces but also the experiment’s metadata. Common bits of metadata that I tend to record include a timestamp for when I triggered the experiment, the timestamps for the individual experiment runs and repetitions, the relevant git commit IDs, metadata about the environment (e.g., VM sizes, cluster information), and all the parameter combinations that were run. Save all the metadata to a file in a machine-friendly format (like CSV or JSON). Avoid encoding experiment metadata into file or folder names (“experiment_1_param1_param2_param3”). This makes it hard to introduce changes over time (e.g. adding a new parameter will likely break your workflow). Propagate the experiment metadata all the way to your graphs, to be sure you know what commit ID and parameter combinations produced a given set of results. Aggressively pepper the workflow with sanity checks (e.g, a graph should never present data obtained from two different commits of your system).
Never, ever, configure your infrastructure manually (e.g., bringing up VMs on AWS using the EC2 GUI, followed by logging into the VMs and installing software libraries and configuring them). Instead, always script these workflows up (I like using Ansible for such tasks). The reason being, that accumulating ad-hoc tweaks and commands with side effects (like changing the OS configuration) impairs reproducibility. Instead, be disciplined about only introducing changes to the infrastructure via a set of well-maintained scripts. They come in handy especially when unexpected failures happen, and you need to migrate to a new infrastructure (literally every project I’ve worked on had to go through this!).
The sooner you start with the above workflows, the better. Once it’s up, just like your tests, you’ll be able to continuously run experiments as part of your development process, and make sure your system is on track as far as your evaluation goals go. Every commit gets backed by a report full of data about how that change affected your system’s metrics of concern. The experiment workflow then becomes a part of your testing and regression suites.
The tracer bullet methodology applies to your experiment setup just as much as it does to the system you’re building. You’ll find your experiment setup evolving in tandem with your system: you’ll add new logging and tracing points, you’ll add new parameter combinations you want to test, and new baselines.
I have a fairly standard workflow I use for every project. It starts with using Ansible to set up the infrastructure (e.g., bring up and configure VMs on EC2), deploy the artifacts, run the experiments, and collect the logs. I use Python to parse the raw logs and produce an SQLite database with the necessary traces and experiment metadata. I then use R to analyze the traces, ggplot for plotting, and RMarkdown to produce a report that I can then send to a Slack channel. A single top-level bash script takes a commit ID and chains all the previous steps together.
Avoiding tunnel-vision
A common risk with system building is to fall into the experiment tunnel-vision trap. For example, frantically trying to improve performance for a benchmark or metric that may not matter, while ignoring those that are important to assess your system.
There are two things you can do to avoid this trap.
First, try to sketch out the first few paragraphs of your paper’s evaluation section as early as possible. This makes you think carefully about the main theses you’d like your evaluation to support. I find this simple trick helps me stay focused when planning experiments (and often made me realize my priorities were wrong!). You’ll find yourself refining both the text for the evaluation section and the experiment workflow over time.
The second is to use what I recommended in the previous section: wait to see a report with data about all your experiments before iterating on a change to your system. Otherwise, you’ll be stuck in experiment whack-a-mole limbo! Make sure your report contains the same graphs and data that you plan to add to the evaluation section.
Experimentation-friendly prototyping
Build experimentation-friendly prototypes. Always use feature flags and configuration parameters for your system to toggle different settings (including log levels). If you find yourself modifying and recompiling your code only to enable/disable a certain feature, you’re doing it completely wrong.
Here’s one scenario where feature flags come in handy. Often, a paper proposes a collection of techniques that when combined, improve over the state-of-the-art (e.g., five new optimization passes in a compiler). If your paper fits that description, always make sure to have the quintessential “look how X changes as we turn on these features, one after the other” experiment. If you only test the combination of these features and not their individual contributions, you (and the readers) won’t know if some of your proposed features negatively impact your system!
And no, for the majority of systems projects, a few additional
ifstatements are hardly going to affect your performance (actual pushback I’ve heard!). If production-ready JVMs can ship with hundreds of such flags, your research prototype can too.Measure, measure, measure
Systems are unfortunately way too complex. If you want to understand what happened over an experiment, there is no substitute for measuring aggressively. Log any data you think will help you understand what’s going on, even if it is data that you won’t present in a paper. If in doubt, always over-measure rather than under-measure.
To borrow a quote from John Ousterhout: “Use your intuition to ask questions, not answer them”. Often, when faced with a performance problem or a bug, it’s tempting to assume you know why (your intuition) and introduce changes to fix that problem. Don’t! Treat your intuition as a hypothesis, and dig in further to confirm exactly why that problem occurs and how it manifests. For example, expand your workflow with more logs or set up additional experiments to control for the suspected factors.
A particularly dangerous example I’ve seen is to declare victory the moment one sees their system beat the baseline in end-to-end metrics. For example, “our nifty algorithm improves transaction throughput by 800x over baseline Y” (ratios that are quite fashionable these days!). Again, don’t assume it was because of your algorithm, but follow up with the required lower-level analysis to confirm you can thoroughly explain why the performance disparity exists. Some basic questions you can ask your data, based on unfortunate examples I’ve encountered in the wild:
- are you sure your database is not faster on reads because all reads return
null? - does your “Big Data” working set fit in an L3 cache?
- is your system dropping requests whereas the baseline isn’t?
- are you measuring latency differently for the baseline vs your system (round-trip vs one-way)?
- are you introducing competition side effects [1] (section 1.5.3)?
- are the baselines faster than your system, but you’ve driven them to congestion collapse?
There are several aspects of measurement methodology that I think every systems student should know. For example, the relationship between latency and throughput, open vs closed loop workload generation, how to understand bottlenecks, how to summarize performance data, the use of confidence intervals, and much more. I highly recommend these books and articles to learn more:
[1] “Performance Evaluation of Computer and Communication Systems”, Jean-Yves Le Boudec.
[2] “The Art of Computer Systems Performance Analysis: Techniques for Experimental Design, Measurement, Simulation, and Modeling”, Raj Jain.
[3] “Mathematical foundations of computer networking”, Srinivasan Keshav.
[4] “Systems Benchmarking Crimes”, Gernot Heiser -
State Of Valhalla
I highly recommend the latest “State of Valhalla” document by Brian Goetz if you’re interested in the Java language (or just language runtimes in general). It gives an accessible overview of this huge shakeup of the JVM, made possible by the breakthrough observation that inline classes and object references can simply re-use the JVM’s “L-carrier type”.
-
Who Do I Sue?
“Thus I will claim that the future of technology will be less determined by what technology can do, than social, legal and other restraints on what we can do. Thus, if you stop to think about computer-controlled highway traffic – it sounds good to you but ask yourself: who do I sue in an accident?”
– Richard Hamming, two decades before self-driving cars were a thing.
You can see the lecture here.
-
Rapid: Stable and Consistent Membership at Scale
This post gives an overview of our recent work on the Rapid system, presented at USENIX ATC 2018 (you can find the paper, slides and presentation audio here ).
Rapid is a scalable, distributed membership service – it allows processes to form clusters and receive notifications when the membership changes.
Why design another membership service?
Rapid is motivated by two key challenges.
First, we observe that datacenter failure scenarios are not always crash failures, but commonly involve misconfigured firewalls, one-way connectivity loss, flip-flops in reachability, and some-but-not-all packets being dropped. However, existing membership solutions struggle with these common failure scenarios, despite being able to cleanly detect crash faults. In particular, existing tools take long to, or never converge to, a stable state where the faulty processes are removed. This is problematic in any distributed system: membership changes often trigger failure recovery workflows, and repeatedly triggering these workflows can not only degrade system performance, but also cause widespread outages.
Second, we note that inconsistent membership views in a system pose a challenging programming abstraction for developers, especially for building critical features in a distributed system like failure recovery. Without strong consistency semantics, developers need to write code where a process can make no assumptions about the world view of the rest of the system.
Enter Rapid
Rapid is a scalable, distributed membership system that is stable in the face of a diverse range of failure scenarios, and provides participating processes a strongly consistent view of the system’s membership. In particular, Rapid guarantees that all processes see the same sequence of membership changes to the system.
Rapid drives membership changes through three steps: maintaining a monitoring overlay, identifying a membership change proposal from monitoring alerts, and arriving at agreement among processes on a proposal. In each of these steps, we make design decisions that contribute to our goals of stability and consistency.
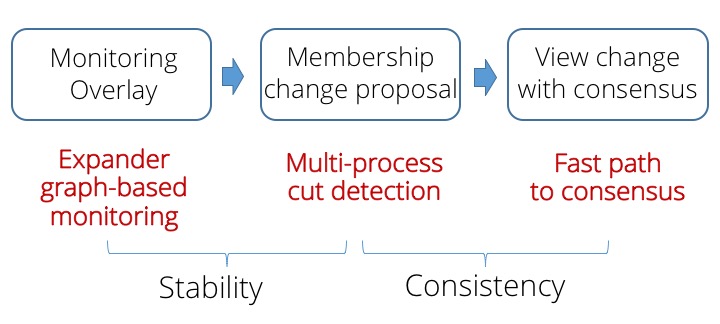
Expander-based monitoring edge overlay. Rapid organizes a set of processes (a configuration) into a stable failure detection topology comprising observers that monitor and disseminate reports about their communication edges to their subjects. The monitoring relationships between processes forms a directed expander graph with strong connectivity properties, which ensures with a high probability that healthy processes detect failures. We interpret multiple reports about a subject’s edges as a high-fidelity signal that the subject is faulty. The monitoring edges represent edge failure detectors that are pluggable.
Multi-process cut detection. For stability, processes in Rapid (i) suspect a faulty process p only upon receiving alerts from multiple observers of p, and (ii) delay acting on alerts about different processes until the churn stabilizes, thereby converging to detect a global, possibly multi-node cut of processes to add or remove from the membership. This filter is remarkably simple to implement, yet it suffices by itself to achieve almost-everywhere agreement – unanimity among a large fraction of processes about the detected cut.
Practical consensus. For consistency, we show that converting almost-everywhere agreement into full agreement is practical even in large-scale settings. Rapid’s consensus protocol drives configuration changes by a low-overhead, leaderless protocol in the common case: every process simply validates consensus by counting the number of identical cut detections. If there is a quorum containing three-quarters of the membership set with the same cut, then without a leader or further communication, this is a safe consensus decision.
How well does it work?
We experimented with Rapid in moderately scalable settings comprising 1000-2000 nodes.
The paper has detailed head-to-head comparisons against widely used membership solutions, like Akka Cluster, ZooKeeper and Memberlist. The higher-order bit is that these solutions deal well with crash failures and network parititions, but face stability issues under complex network failure scenarios like asymmetric reachability issues and high-packet loss. Rapid is stable under these circumstances because of its expander-based monitoring overlay that can better localize faults and its approach of removing entire cuts of faulty processes.
At the same time, Rapid is also fast. It can bootstrap a 2000 node cluster 2-5.8x faster than the alternatives we compared against, despite the fact that Rapid offers much stronger guarantees around stability and consistency.
Lastly, Rapid is comparable in cost to Memberlist (a gossip-based protocol) in terms of network bandwidth and memory utilization.
We also found Rapid easy to integrate in two existing applications: a distributed transaction data-store, and a service discovery use case.
We believe the insights we identify in Rapid are easy to apply to existing systems, and are happy to work with you on your use case. Feel free to reach out to me if you’d like to chat!
References
USENIX ATC 2018 paper, slides and presentation
Code on Github
VMware Research Group